Seeing The Bubble of Our Sun’s Influence
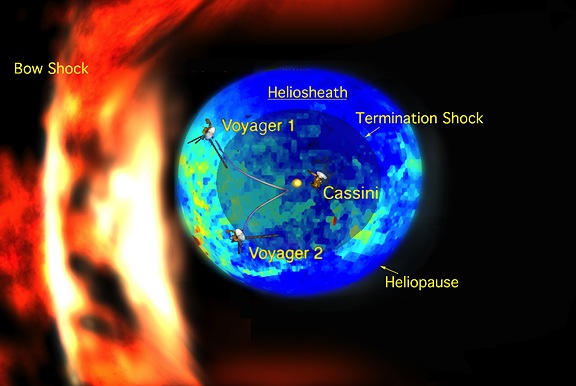
NASA: New data from NASA’s Cassini spacecraft suggest that the shape of our solar system moving through the local Milky Way galaxy looks like a bubble — or a rat — traveling through a boa constrictor’s belly. The boa’s ribs (flame-like curtains on the left side of the illustration) mimic the local interstellar magnetic field, expanding and contracting as the rat passes.
NASA: New data from NASA’s Cassini spacecraft suggest that the shape of our solar system moving through the local Milky Way galaxy looks like a bubble — or a rat — traveling through a boa constrictor’s belly. The boa’s ribs (flame-like curtains on the left side of the illustration) mimic the local interstellar magnetic field, expanding and contracting as the rat passes.
In this illustration, the multicolored (blue and green) bubble represents the new measurements of the emission of particles known as energetic neutral atoms. The energetic neutral atoms were streaming in from the thick boundary known as the heliosheath. The heliosheath is the region between the heliosphere, the region of our sun’s influence, and the interstellar medium, the matter between stars in our galaxy. Areas in red indicate the hottest, most high-pressure regions and purple the coolest, lowest-pressure regions.
The yellow circle is our sun. The two Voyager spacecraft, illustrated with lines showing their path, are currently traveling through the heliosheath. In the heliosheath, the solar wind slows down and heats up as it interacts with the interstellar medium. The image also shows Cassini, which is still inside our solar system, orbiting Saturn. The spacecraft sizes are not to scale.
The dark inner circle represents the volume bounded by the termination shock, formed where supersonic solar wind streaming out from our sun suddenly slows down. The outer circle, known as the heliopause, the outer boundary of the heliosheath, is the place where the interstellar medium and the solar wind are balanced. To the left of this bubble is the curve of the putative bow shock, where the interstellar medium, traveling in the opposite direction against the heliosheath, slows down as it collides with the heliosphere. The bow shock resembles a wave formed in a stream as it flows around a rock.
Full resolution jpeg (1.7 Mb)
An animation of the new model is also available here http://photojournal.jpl.nasa.gov/catalog/PIA12310
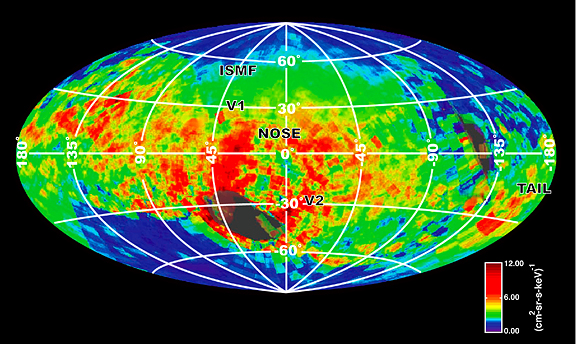
This image shows high-energy particles in the 6 kilo-electron-volt range, with red indicating the hottest, most high-pressure regions and purple the coolest, lowest-pressure regions. The map was generated based on galactic coordinates, which centers the map around our sun and lines up the plane of our galaxy with the map’s equator. Full resolution jpeg (772 Kb)
The label “nose” indicates the direction of the flow of interstellar plasma, or hot, ionized matter. The label “tail” indicates the view behind us. V1 and V2 indicate the locations of NASA’s Voyager 1 and Voyager 2 spacecraft. “ISMF” denotes the estimated direction of the Interstellar Magnetic Field, which surrounds our solar system and pushes against the heliosphere at an angle. Some areas are colored gray to indicate incomplete coverage because of interference from the sun and Saturn.
The Cassini-Huygens mission is a cooperative project of NASA, the European Space Agency and the Italian Space Agency. NASA’s Jet Propulsion Laboratory manages the mission for the Science Mission Directorate at NASA Headquarters in Washington. The Cassini orbiter and its two onboard cameras were designed, developed and assembled at JPL. The magnetospheric imaging instrument was designed, built and is operated by an international team led by the Applied Physics Laboratory of the Johns Hopkins University, Laurel, Md.
For more information about the Cassini-Huygens mission visit http://saturn.jpl.nasa.gov. The instrument team’s homepage is at http://sd-www.jhuapl.edu/CASSINI/index.html.


