NASA Analyzes California’s Rainfall from Space
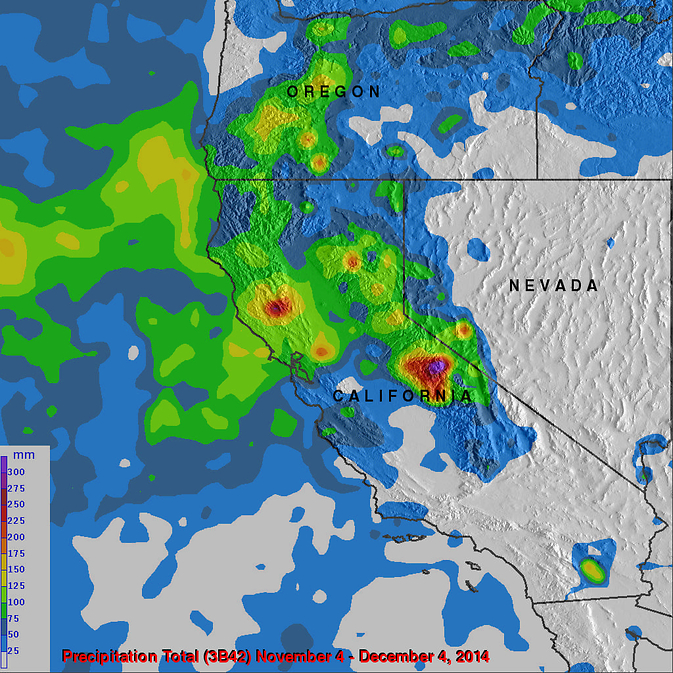
The rainfall analysis from Nov. 4 to Dec. 4 shows northern California received the most precipitation with highest totals over 300 mm (11.8 inches) in some areas. Heavy precipitation that fell at higher elevations will add to snow pack totals. Image Credit: SSAI/NASA/JAXA, Hal Pierce
The Tropical Rainfall Measuring Mission or TRMM satellite and Global Precipitation Measurement or GPM constellation of satellites can measure rainfall from space. Data from TRMM and GPM were used to analyze the record-setting rainfall that fell this week in California.
Both TRMM and GPM are managed by both NASA and the Japanese Space Agency, JAXA. At NASA’s Goddard Space Flight Center in Greenbelt, Maryland, a rainfall analysis was done using data from TRMM, GPM and other satellites for the California rain event.
It has been very dry in the state of California for the past couple years. The lack of rain in 2013 and 2014 contributed to exceptional drought conditions in the state. Records were set over the past winter for the lowest winter snow packs recorded in a century. Rainfall produced by storms moving into California from the Pacific Ocean has recently brought some very temporary drought relief.
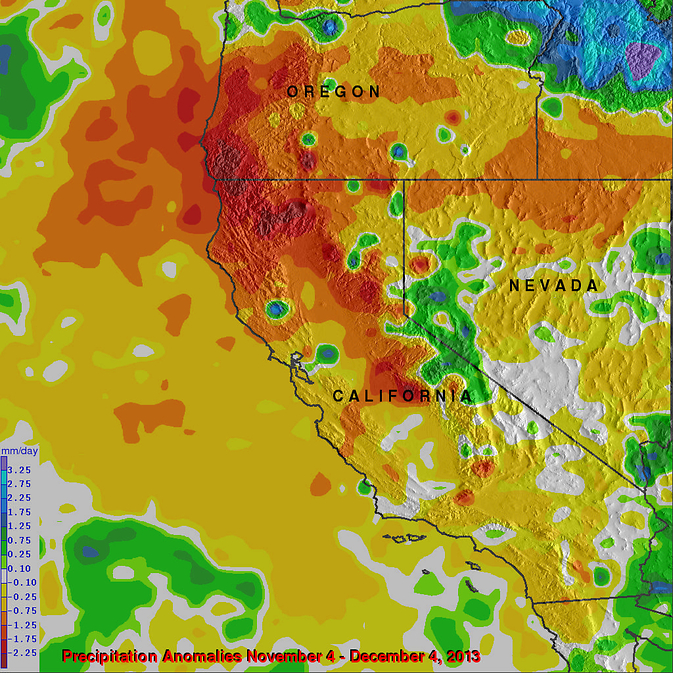
This analysis for rainfall data collected a year ago from Nov. 4 to Dec. 4, 2013 showed deficits of as much as 2.25 mm (8.8 inches) in several areas (red). Image Credit: SSAI/NASA/JAXA, Hal Pierce
Precipitation data from various satellites such as TRMM and the GPM core observatory satellite have been collected, merged and archived at NASA Goddard since 1998 for TRMM, and starting this year for GPM. The long term collection of these data will enable increasingly accurate measurements that will be useful in global precipitation climatology.
The rainfall analysis created at NASA showed estimates of total precipitation that fell over the western United States during the past month, from Nov. 4 to Dec. 4, 2014. Northern California received the most precipitation. This analysis indicated that downpours over the past few weeks had dropped totals of over 300 mm (11.8 inches) in some areas. Heavy precipitation that fell at higher elevations will add to snow pack totals.
The two rainfall anomaly analyses were made by comparing rainfall data compiled during the twelve year period from 2001-2012 to “near real-time” Multi-satellite Precipitation Analysis data.
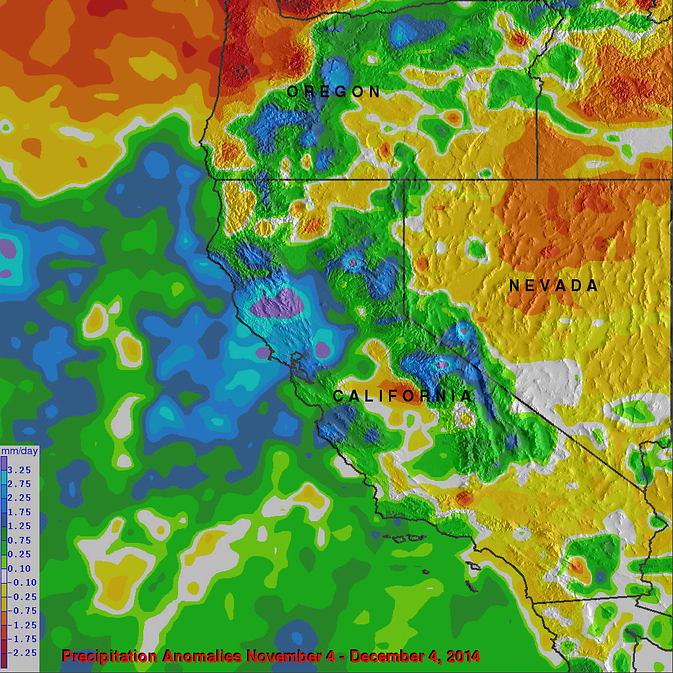
Rainfall analysis from Nov. 4 to Dec. 4, 2014 showed higher than average totals in northern California. The above normal precipitation (wetter – from light green to purple) and below normal values (drier – yellow to dark red). Image Credit: SSAI/NASA/JAXA, Hal Pierce
The first analyses (made into an image at NASA Goddard) showed a rainfall anomaly analysis for rainfall data collected a year ago from November 4 to December 4, 2013 and showed deficits of as much as 225 mm (8.8 inches).
The second image analysis showed a rainfall anomaly analysis for the same period in 2014. It showed higher than average totals in northern California ranging from 1.75 to 3.25 mm per day. The images were color-coded. The above normal precipitation (wetter) was shaded in colors ranging from light green to purple and below normal values (drier) are shown in colors from yellow to dark red. Extensive areas of drier than normal values in 2013 were observed in sheer contrast to the recent wetter conditions.
Harold F. Pierce
SSAI/NASA’s Goddard Space Flight Center


