
First “Solar Weather Maps” Show Changing Wind Patterns on a Star
The surface of the sun is covered with transient storms, high and low
pressure zones and swirling wind flows that vary from day to day like
weather patterns on Earth’s surface, according to new results by
University of Colorado at Boulder researchers using the Solar and
Heliospheric Observatory, or SOHO.
The results are being presented at the spring American Astronomical
Society meeting held in Albuquerque, N.M., June 2 to June 6. SOHO is
a joint satellite mission between NASA and the European Space Agency.
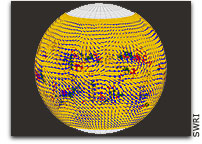
The results include the first large-scale weather maps of wind
patterns evolving daily across the entire visible solar surface, said
the researchers. The results also may overturn a longstanding theory
of solar activity.
“For the first time, we can see large-scale weather systems
developing on the surface of a star,” said CU-Boulder researcher
Deborah Haber. “That is important because the sun’s surface weather
patterns steer larger effects like the sun’s rapidly changing
magnetic field, the mysterious 1 million-degree corona and the
violent interplanetary storms that arise from solar coronal mass
ejections.”
The new weather maps show flow patterns and jet streams twisting
through the background turbulence, with typical speeds of up to
100 mph, she said. They also show “storm systems” with spinning
flow similar to terrestrial hurricanes, but large enough to swallow
Jupiter, forming and dissipating in less than three weeks.
In addition, the maps show a startling global weather pattern on
the sun. A steady 45-mph “breeze” flows from the equator to the
poles at the sun’s surface, extending downward to depths of at least
15,000 km — about the diameter of Earth.
The new weather maps reveal that in the sun’s northern hemisphere
the northward breeze stopped and reversed direction in 1998 and has
retained the new direction since that time. “We are seeing a global
weather shift on the sun like the El Nino pattern here on Earth,”
said Haber.
CU-Boulder paper authors Haber, Brad Hindman and Juri Toomre also
are members of JILA, a joint institute of CU-Boulder and the
National Institute of Standards and Technology laboratory in Boulder.
The reversed flow is especially important because steady, “poleward”
breezes play a crucial role in generating the solar magnetic field,
said Haber, the paper’s chief author. The reversed flow also helps
cause the mysterious solar cycle that reverses the magnetic field
every 11 years and gives rise to sunspots and space weather.
“Steady flows toward the poles are thought to disperse and transport
the strong magnetic fields from sunspots to the poles, where they
reverse the existing field every 11 years,” said Alexander
Kosovichev, a solar researcher at Stanford University. “The reversal
of this flow is puzzling, and has important implications for our
understanding of the solar activity cycle.”
The research team created the maps from data produced by the
Michelson Doppler Imager, or MDI, telescope aboard SOHO using a
computationally efficient technique called “ring-diagram analysis.”
The technique measures the speed and direction of sound waves of
different frequencies at many different locations on the sun to
build a 3-D image of structures just under the sun’s surface.
Ring-diagram analysis is part of the growing field of
helioseismology, or seismology of the sun.
“We observe ripples on the surface of the sun and measure how their
speed varies in different directions,” said Hindman. “Ripples
traveling with the local wind move faster than ripples going against
the wind, so we can tell the direction and speed that the material
is moving.”
Unlike ripples on a pond, the motions observed by MDI are caused by
very deep solar sound waves with periods of 5 minutes — about 14
octaves below the range of human hearing.
Other techniques such as “time-distance helioseismology” and “sonic
holography” are used to identify detailed structures in individual
regions of the sun. But ring-diagram analysis complements them
because it is more computationally efficient and allows large areas
of the sun to be mapped rapidly, said Hindman.
For downloadable maps of solar magnetic fields, wind flows and
surface ripples, go to the Web site link:
http://www.boulder.swri.edu/~deforest/wxmaps/


