NASA: Results from HET Smartphone in Space
 SPHERES operates inside the Japanese Experiment Module (JEM). As shown in the diagram below, we’ve defined a JEM coordinate system with X forward, Y starboard, Z toward the deck, and the origin in the middle of the module. For our test, Expedition 29 Commander Mike Fossum velcroed the smartphone to the -X face of the sphere and placed the sphere at the origin of the coordinate system. From a laptop, he ran a program on the sphere to translate it one meter to +X and back to center, one meter to +Y and back, and one meter to +Z and back. Then the sphere made a full rotation about each of the X, Y, and Z axes.
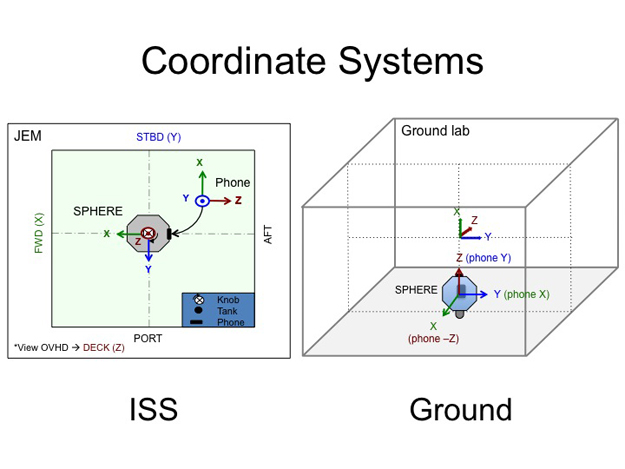
Figure 1 – Coordinate Systems. We define X-forward, Y-starboard, and Z-deck in the Japanese Experiment Module. On the ground Y and Z are parallel to the plane of the table, and X is up. The smartphone uses the coordinate system defined in the Android documentation which has X up and Z pointing out of the screen. The sphere itself has its own coordinate system.
After the on-orbit test, we ran a similar series of tests with a sphere and a smartphone on the ground. On the ground, the sphere floats in an air carriage on a table and is constrained to three degrees of freedom. Usually planar degrees of freedom are called X, Y, and rotation about Z, but because of the shape of our ground lab, we had to label these degrees Y, Z, and rotation about X. Everyone should try thinking sideways now and then.
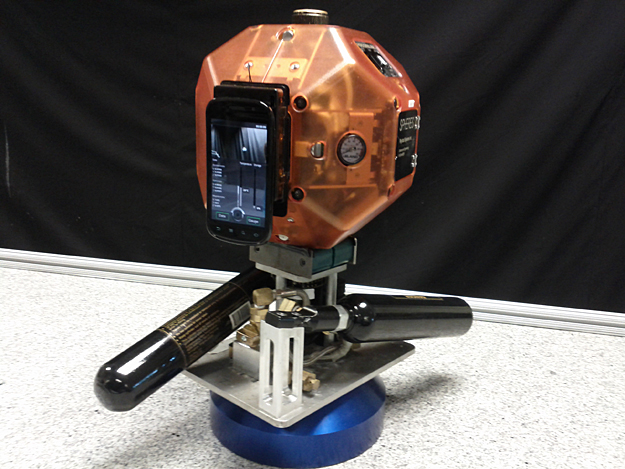
Figure 2 – SPHERES and HET Smartphone on an air carriage. The black tanks contain carbon dioxide, which is forced out the bottom of the blue puck. When the air carriage is on a flat, level surface, the CO2 overcomes enough friction for the sphere to move itself around with its thrusters. In our lab, the table top is the YZ plane.
The Logger App (available on the Android Market here) ran on the phone during all these tests. The app recorded data from all available sensors on the phone, though not all the sensor data was usable. For instance, in space the GPS never got a lock on enough satellites to figure out a position; that’s not surprising since the unit wasn’t designed to be 200 miles above sea level, whizzing around the earth every 90 minutes. The battery temperature stayed normal, and the proximity sensor was also unenlightening, since the astronaut didn’t put the phone up to his face. The fun data came from the gyroscope, accelerometer, and magnetic field sensor, which we look at in the next section.
The Data
In this section, we compare data collected in orbit to data collected on the ground. First, let’s look at the gyroscope data. Here are plots that show the sphere rotating 360 degrees about its Y axis.
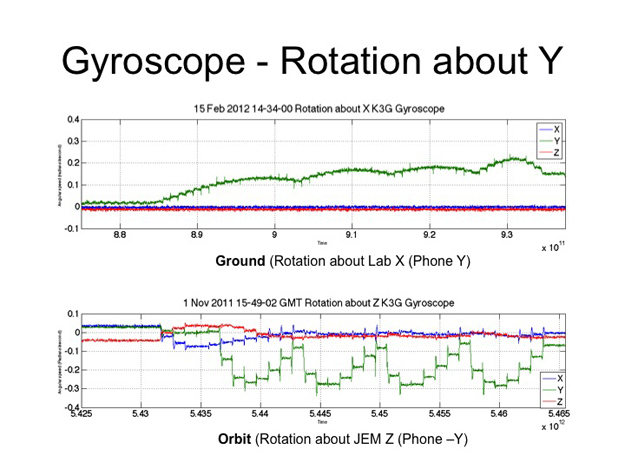
Figure 3 – Smartphone gyroscope data shows that the SPHERES unit moves differently in orbit than on earth.
The X axis shows time in nanoseconds since the phone started up. The Y axis shows angular speed in radians per second. The top plot shows rotation about Y, the bottom plot shows rotation about negative Y, so the spheres were in fact rotating opposite directions during these tests. The graphs each have four humps because of the way the motion was programmed; the sphere rotated 90 degrees and paused, then another 90 degrees and paused, and so on. The sphere came closer to a complete stop between turns in orbit than it did on the ground.
The ISS sphere turned faster (reaching nearly -0.3 radians per second) than the ground sphere (barely 0.2 radians per second), resulting in the test taking less time to run on orbit (~25 s) than it did on the ground (~45 s). The spheres do not have a “speed” setting, they simply go to their commanded position as quickly as possible, so the sphere in space was faster because it did not have to pull an air carriage around with it, and because it had less friction.
In the orbit plot, there are spikes causing “stair-steps” at regular intervals. Those spikes are caused by the sphere’s thrusters firing. The thruster spikes are visible but smaller in the ground plot, once again because of mass and friction differences. The blue and red X and Z lines are also interesting: in the ground plot, they are perfectly flat. The sphere was securely in an air carriage and couldn’t tip. In the orbit plot, the graph shows a bobble in X and Z at the beginning of the test as the sphere tried to align itself with the coordinate axes. The sphere aligns well by the end of the first quarter rotation, but the X and Z lines show residual oscillation, showing that the sphere is clearly not sitting on a level table.
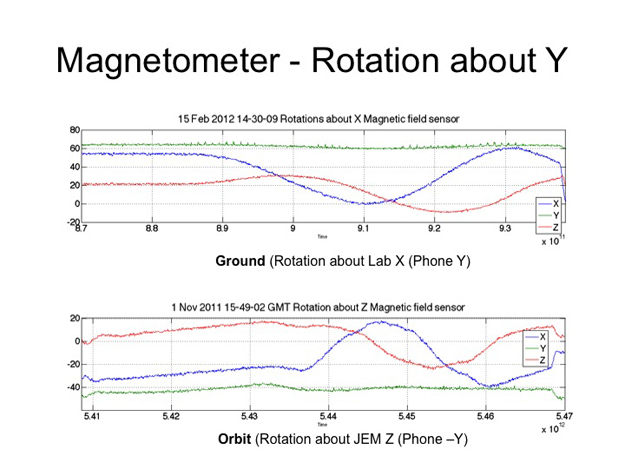
Figure 4 – Magnetometer data does not show as many differences between the ground and on-orbit tests.
Here are plots of magnetometer data gathered during the same tests. The X axis of the plot is time in nanoseconds and the Y axis is magnetic field strength in microTesla. We can tell that the phone was rotating about its Y axis, and that the sphere on the ground is more stable than the true free flyer. The plots suggest that the magnetic field strength in orbit is lower than it is on the ground, but we can’t draw conclusions because we didn’t calibrate the magnetometers on either of the phones before running the tests. We decided that calibrating the magnetometers was not important enough to warrant the time required, particularly considering the busy schedule of the ISS crew.
Figure 5 – Gravity Sensor. Data from the gravity sensor shows the phone was actually in orbit!
I enjoyed the data from the gravity sensor on the phone. As you can see, gravity on earth is a healthy 9.8 m/s^2, and the gravity measured in orbit is 0 m/s^2. (It looks like there’s a very small negative bias in the phone sensors). If you think we staged the pictures of the floating sphere, here is the hard data to prove we didn’t ![]() .
.
Figure 6 – Linear Accelerometer. The sphere did not move fast enough to register on the linear accelerometer.
The sphere’s movement did not register on the linear accelerometer, either on the ground or in orbit. The sphere has a mass of about four kilograms with only twelve 0.1 N thrusters to move it around, so it moves at a very sedate pace. The phone is calibrated to measure faster motions.
And everybody’s favorite sensor, the video camera.
The smartphone recorded this video during the Smartphone-SPHERES thruster checkout test. In the video, Mike Fossum places the sphere (with the smartphone already attached) in position and starts the test. All tests begin with 10 seconds of the sphere drifting while its state estimator converges. The video shows flashes from JAXA astronaut Satoshi Furukawa taking pictures during this test. It appears that the flashes cause the sphere to reset in the middle of the test, and the sphere ends up drifting. One of the sonar beacons that is part of the sphere’s localization system comes into view at 0:51. It is a small dark box with a green light in the upper lefthand corner. It’s visible again at 1:18.
So there you have it, results from the first smartphone to operate in orbit. Because the sphere already has its own suite of sensors and well-tested state estimation code, we do not currently plan to use the sensors on the smartphone for localization. In fact, our next goal will be to connect the sphere and the smartphone with a cable so they can exchange data, including the sphere’s position. The phone will receive commands from a laptop over wi-fi, and send position commands to the sphere through the cable. We hope to test the new sphere-phone system later this year.